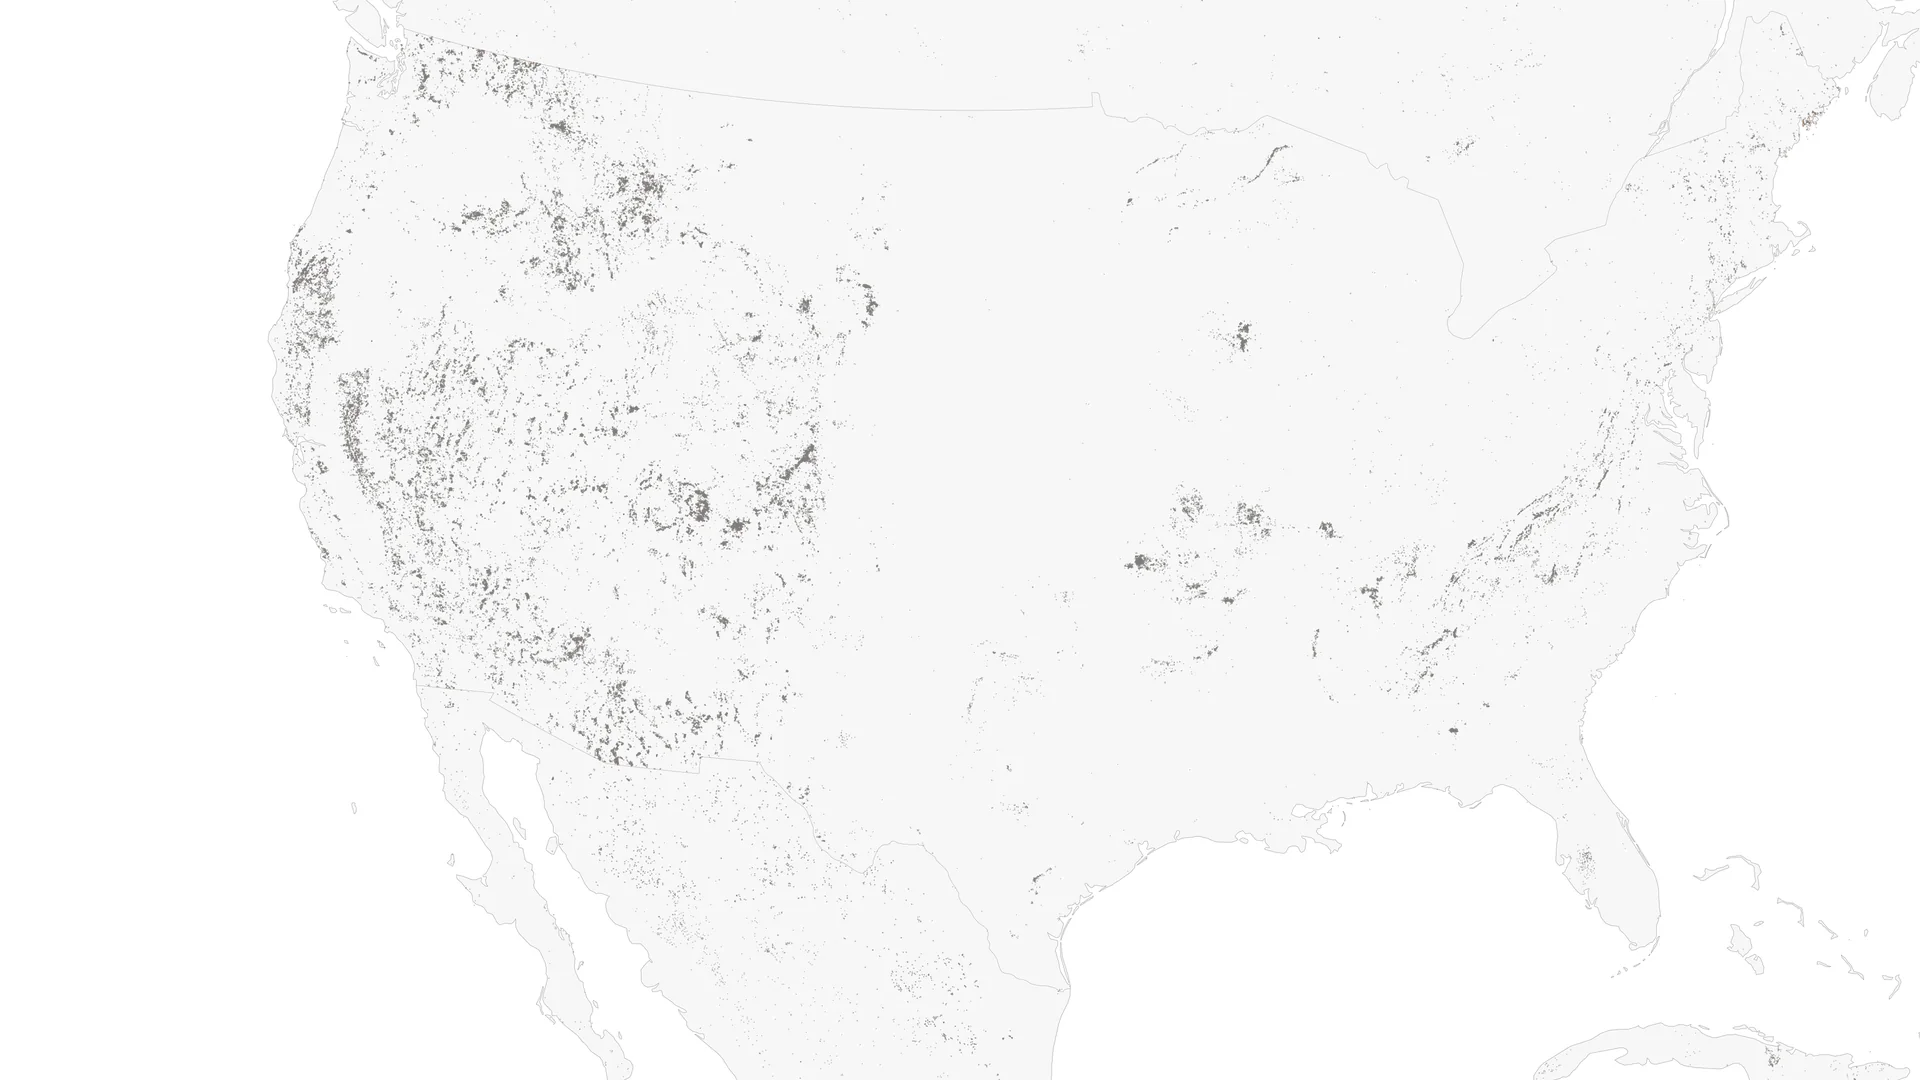
Most scientific data was collected for a person to read, one source at a time. A geologic map, a stream-sediment survey, a regulator's well file and a clinical-trial record each use their own identifiers, units, projections and gaps. Before a model can learn from them together, they have to agree on what a place, a well, a gene or a drug is. This step determines what the later stages can do.
Current work
- A national geoscience datalake. 71 datasets from the USGS and NASA, 2.09 million geochemistry records, sixteen geophysical grids, 5.78 million geologic polygons and 350,874 mineral occurrences. Each source has its own acquisition, cleaning and harmonization pipeline, and every band keeps its lineage. It runs in production as TerraNavitas Minerals.
- A multi-state oilfield dataset. Wells, permits and production from sixteen state regulators, BOEM, USGS, EIA and the Texas Bureau of Economic Geology, curated into one data lake. It runs in production as TerraNavitas ODIS.
- A biomedical evidence graph. Forty-three registered sources, each with its license, resolved to stable identifiers for diseases, targets, drugs, trials, publications, pathways and biomarkers, and joined by declared relationships. It runs in production as Curasynth.
- A common data interface. A data gateway that serves any of these collections by name, from local disk, S3, Azure or Google Cloud Storage, as Apache Arrow, within a memory budget, so a map, a notebook, a model and an agent all read the same thing.
- national geoscience datasets harmonized onto one grid
- 71national geoscience datasets harmonized onto one gridDatalake snapshot of April 2026; public sources only.
- state regulators, plus BOEM, USGS, EIA and the Texas Bureau of Economic Geology, in one oilfield dataset
- 16state regulators, plus BOEM, USGS, EIA and the Texas Bureau of Economic Geology, in one oilfield dataset
- registered biomedical sources, each with its license, joined into one evidence graph
- 43registered biomedical sources, each with its license, joined into one evidence graph
Grid design
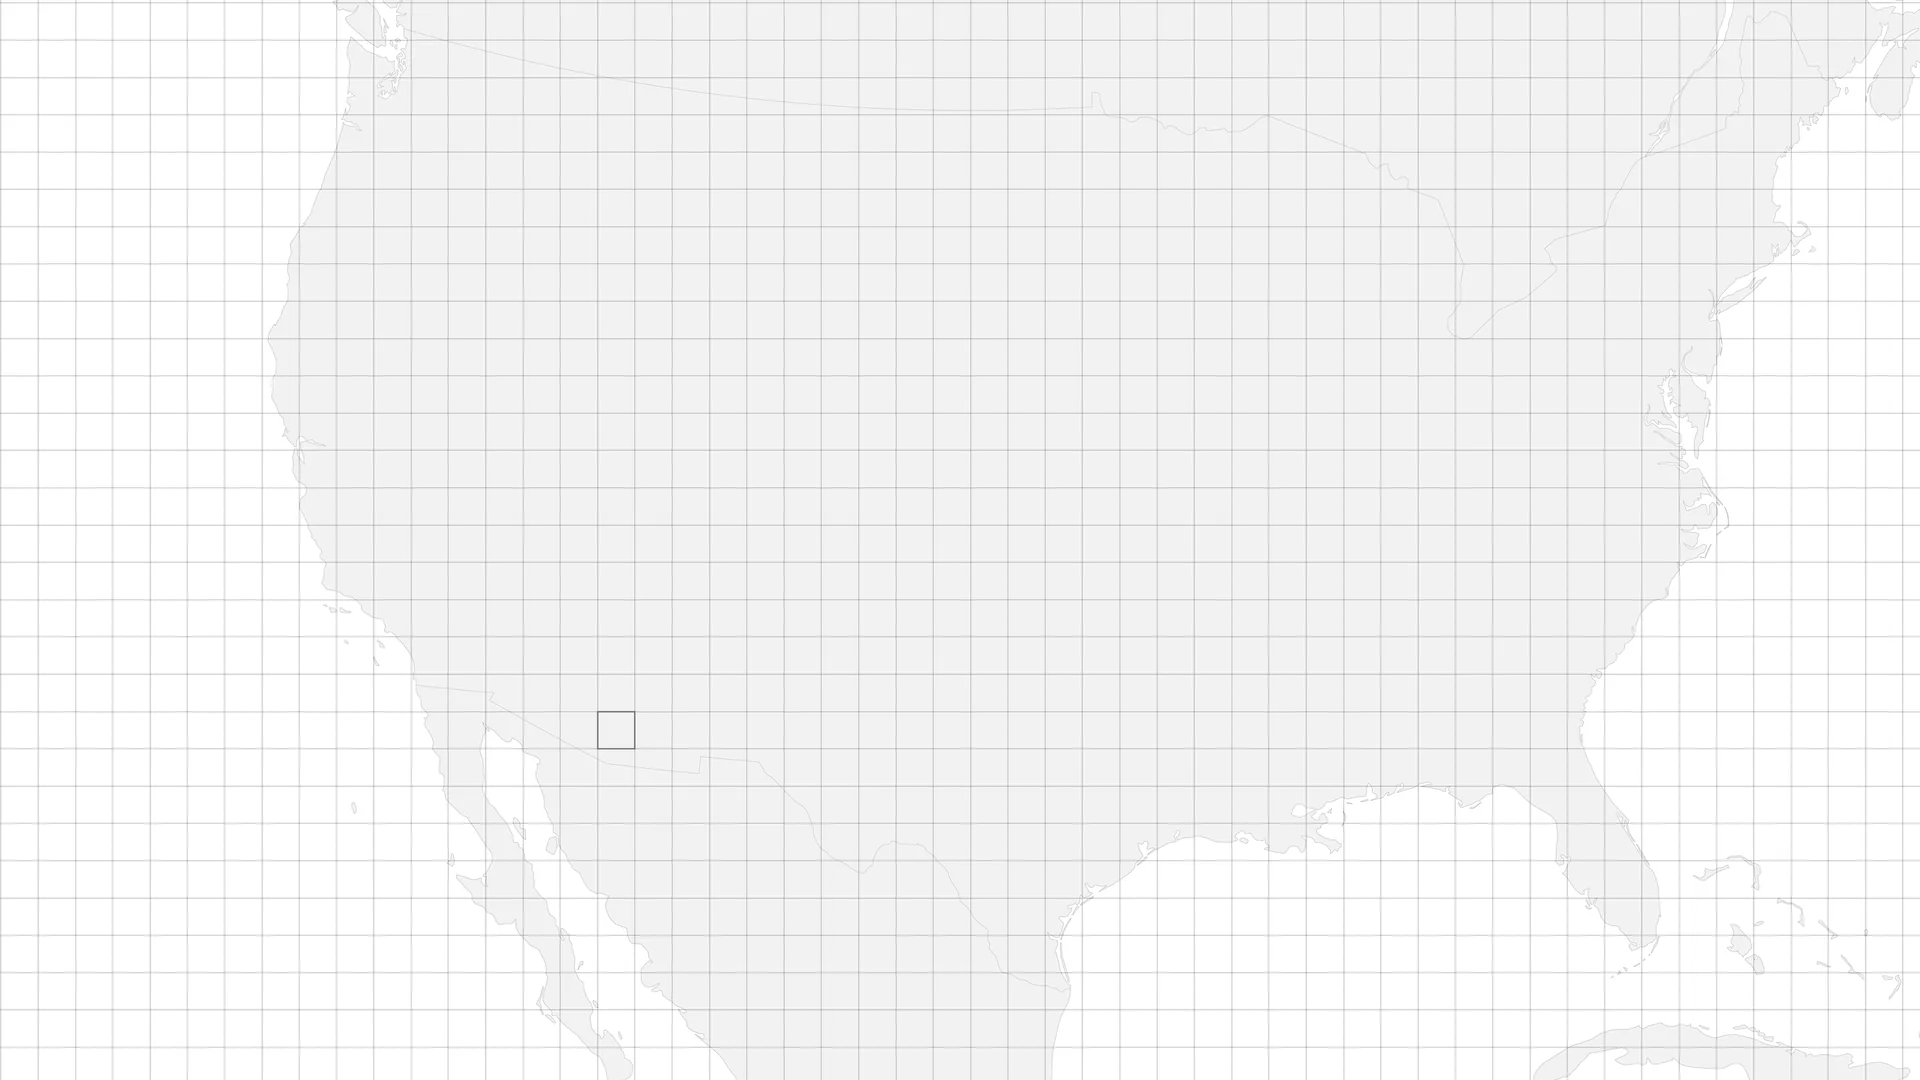
Exploration features are directional: tilt derivatives, edge filters, lineament textures. On a global equal-area projection, angles over Arizona are off by 25° and over interior Alaska by more than 60°, and every derivative inherits the error. The geoscience datalake keeps satellite pixels on native 10–90 m tiles and national surveys on 108 km equal-area cells from 250 m to 4 km, with under 3° of angular distortion across the lower 48, and computes direction-dependent features before it aggregates.
Open problems
- Combining points, rasters and polygons. Geochemistry is irregular points, geophysics is gridded, and geology is polygons with topology. Rasterizing all of them loses structure that geologists use. We are working on representations that keep each geometry.
- Sparse and biased training labels. Known deposits cluster where people have explored, so a model trained on them can learn exploration history instead of geology. We use spatially blocked validation and leave-one-deposit-out tests.
- Pretrained geoscience models. Masked multimodal pretraining on the harmonized record, followed by adaptation to a commodity or region, could transfer what is learned to areas with fewer surveys. We have not trained such a model yet.
The geoscience datalake is available in TerraNavitas Minerals. terranavitas.ai/minerals ↗ (opens in a new tab)